Marketing your company effectively takes much more than luck. It takes a lot of trial and error, as you tinker with strategy and tactics to get things right and learn more about what your consumers want. Countless hours often are spent planning the perfect marketing piece, looking at different layouts, headlines and offers, trying to come up with the winning combination.
Wouldn’t it be great if you could somehow be there when the consumer looks at your marketing piece or website for the first time, seeing what they like and what parts they respond to? Well, when it comes to your website (the most important part of your marketing plan), using Google Analytics can provide you with valuable insights into your consumers’ behaviors, helping to improve your website and other marketing initiatives.
The best part of Google Analytics is you don’t have to be a “web genius” to use it. After installing some simple code on your website—a task that can be performed by any website manager—you start receiving some pretty great data about your customers. We’ll take a look at five valuable insights provided by this free Google-based tool.
Setting up goals and the Funnel Visualization Tool
All too often when examining Analytics accounts, I notice the user has not set up any “goals.” Tracking visitors and behaviors are important, but unless you measure how effective your website is at gaining new customers, you don’t know if it’s good enough for the investment you’re making. Visits are nice, but in the real world we need customers. Setting up goals is the easiest way to see if your visitors are converting into customers.
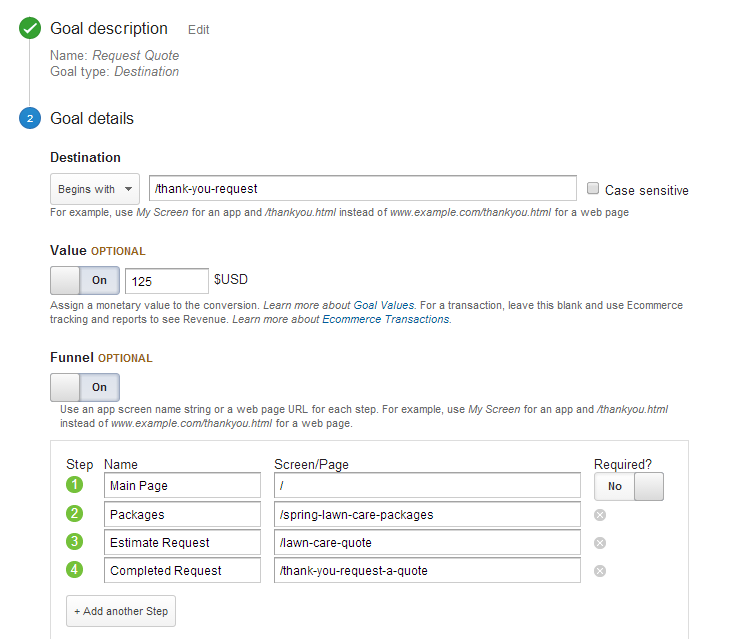
Setting up goals in Google Analytics is a simple enough process in your administrator tabs. Better yet, you can set up many different goals, depending on the number of products you sell and the differing paths through the buying process. You can set up a goal based on your visitor reaching a certain page, such as a “thank you” page after requesting an estimate; duration on the site, such as 5 minutes or more; pages viewed; or an event, such as playing a video.
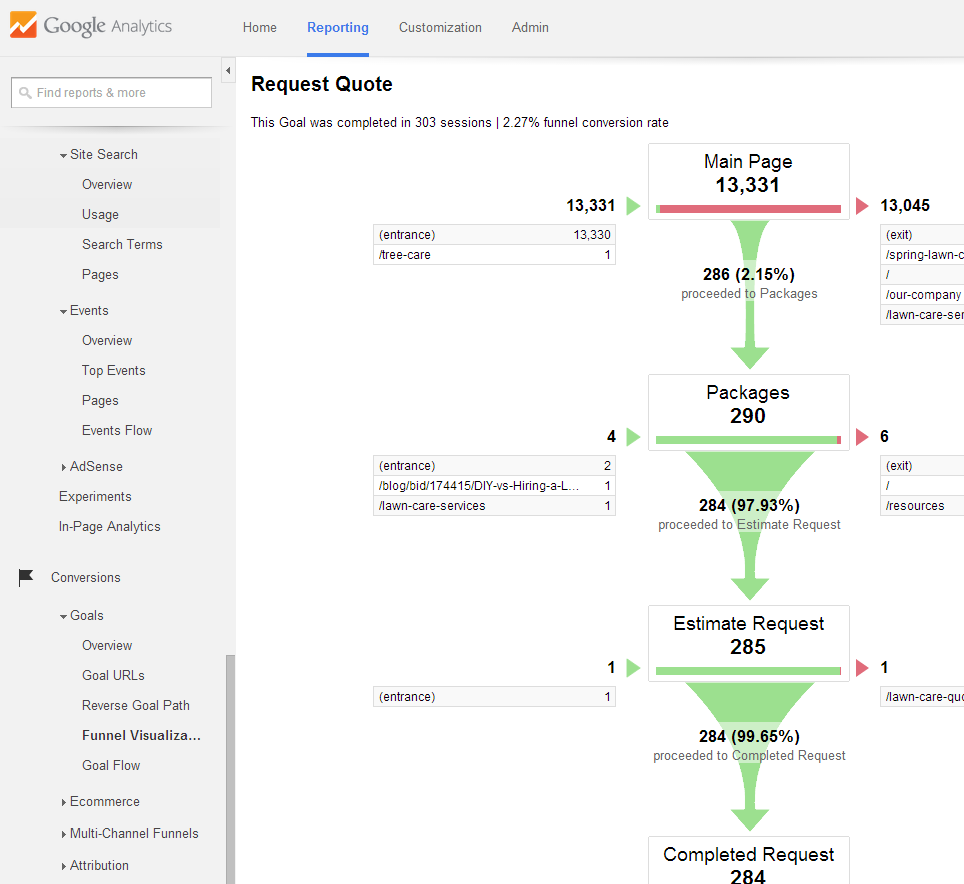
When creating each goal, you also can list the page-path the consumer must take to reach it. By setting up this feature, you then can use the Goal Funnel Visualization Tool to see how visitors move throughout your goal process. This can be very powerful, helping you to create the easiest path for visitors to become customers. Knowing points of visitor drop-off allows you to identify holes in the process, improving the number of conversions you receive.

In-Page Analytics
Do you know which buttons are more popular than others on your different webpages? With Google Analytics’ In-Page tool, you can visually go through your entire website, viewing the number of clicks each button/link on your page receives during a certain time range with a cool overlay feature. By seeing what your visitors click on, you can adjust your website by removing irrelevant links from the page, while focusing on the best performing ones.
Social Overview
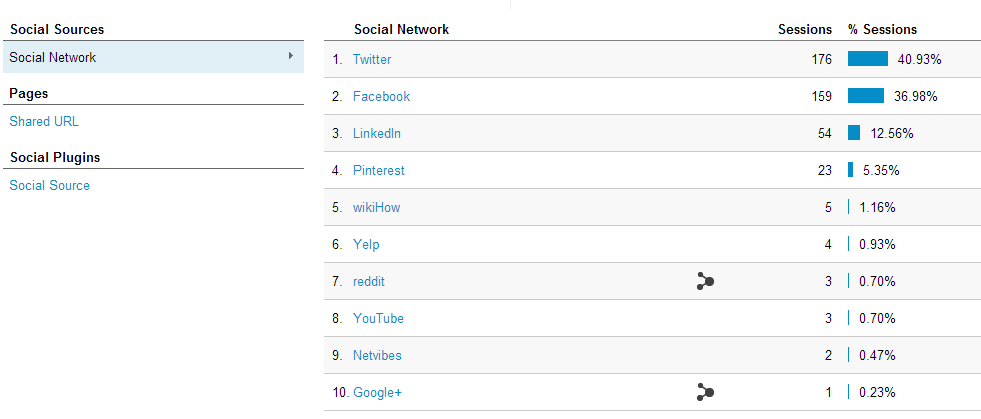
You have several social media sites for your business, and you publish content to all of them on a regular basis. But does any of it pay off with customers and visitors to your site? With the Social Overview feature in Analytics, you can see which social media platform delivers visitors and, better yet, which of those visitors convert. This allows you to focus on channels that produce, allowing you to determine times and frequency of social media posts.
Landing Page Analysis
The key to converting visitors into customers online is creating landing pages that get consumers to take that “next step.” With the Landing Page Analysis tool, you can see which pages receive the highest amount of traffic and monitor conversions. This tool particularly comes in handy for content marketers who are looking to create content on a regular basis. Using this tool, you can track and sort blog articles by how successful they are, helping you to determine future blog article topics.
Audience Reports: Demographics, locations, mobile preferences
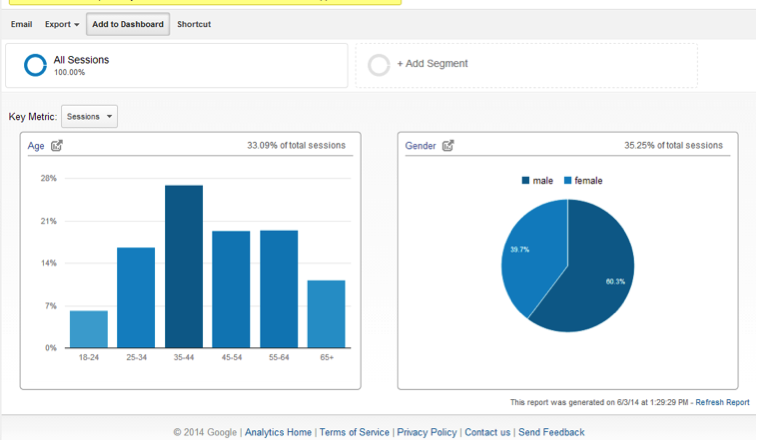
Perhaps the most underutilized tool in Analytics, the Audience Reports section, allows you to gain a better perspective of who your audience is. Thanks to the power of computer programming, Google can give you a better picture of who your visitor is, with the following insights:
- Basic demographics: This includes gender, age and interests, which can help you with both your online and direct mail lists.
- Location: With this feature, you can see which cities your customers are coming from.
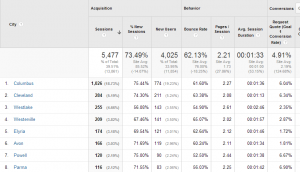
Location (click to enlarge) This can help you plan placements of digital ads (e.g., Google Adwords) and traditional outbound marketing campaigns, such as mailers and newspaper ads, in areas where there is demand for your product.
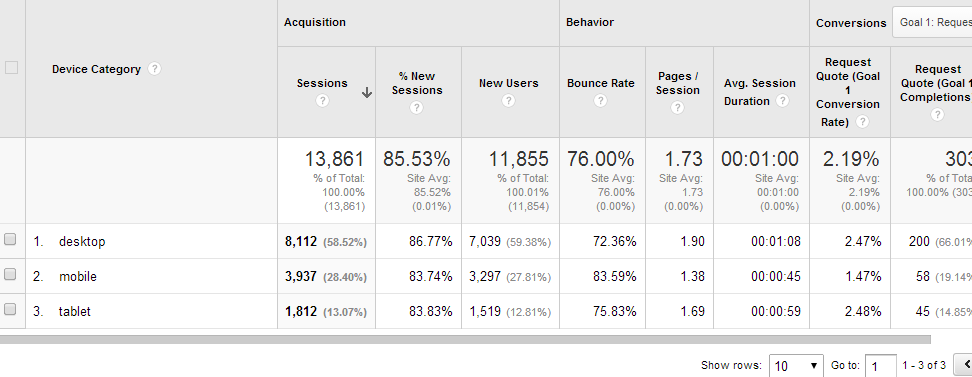
- Mobile preferences: This feature permits you to see the number of visitors by device, allowing you to evaluate their experience on different device formats. A large number of visitors with little to no conversions on a certain device can indicate a problem with your site that is causing you to lose business.

With countless other features not mentioned above, Google Analytics is a great tool for getting to know your customers better, allowing you to create more marketing and sales collateral they will respond to. If you’re new to Google Analytics, be sure to visit its YouTube Channel that contains various lessons, tips and tricks on using all of the features of this product.