Finding the right balance between lowering a site’s water usage and maintaining a large plant palette isn’t a one-and-done job.
Gone are the days of the “set it and forget it” mindset when it comes to landscape water management—especially with water for urban landscapes becoming more limited. Instead, take an active approach by using irrigation monitoring systems, communicating with those walking the sites and establishing practices. But how can you go deeper and actually refine your landscape irrigation method?
In an Oct. 21 webinar with the Irrigation Association (IA), “Refining the Landscape Watering Coefficients for Your Sites,” Mark Crookston, irrigation management department manager for Northern Water in Berthoud, Colo., shared this equation to calculate soil water depletion so you can make appropriate adjustments to your watering strategy:
ET=ETo x (KvKdKs+Ke) x Kmc
Here are the six components (in the order of the equation) of determining a landscape’s evapotranspiration (ET) that you need to verify and refine so you can improve efficiency.
1. Reference ET (ETo)
Use the best available data source, whether it’s from a nearby weather station, on-site air temperature sensor or the internet. Just remember there is lag time between what happens and the response, Crookston says: The data are normally good when averaged during a five- to seven-day period.
If you rely on a local weather station, make sure it’s in an open area over well-watered vegetation that’s away from buildings and pavement. An on-site air temperature sensor can include a sunlight sensor and smart irrigation controllers. Figures you will find on the internet aren’t site specific; they are typically an average for a large area.
2. Factor for Vegetation Type (Kv)
Vegetation categories include trees, shrubs, ground cover, annuals, mixture (trees, shrubs and ground covers), cool-season turfgrass and warm-season turfgrass.
You can choose the Kv for high performance, acceptable appearance or low maintenance, depending on the client’s expectations. Trees, for example, are 0.90 to 0.95 for high performance, 0.70 to 0.75 for acceptable performance and 0.45 to 0.50 for low maintenance. (See the IA’s “Irrigation, Sixth Edition” for all plant categories and performance levels.)
3. Factor for Plant Density (Kd)
Consider the collective leaf area of the plant’s covering or the shading area of the ground. The value, which can be measured directly, will range from 0 to 1, with 1 being when 70 to 80 percent or more of the ground is shaded at midday.
4. Factor for Plant Water Stress (Ks)
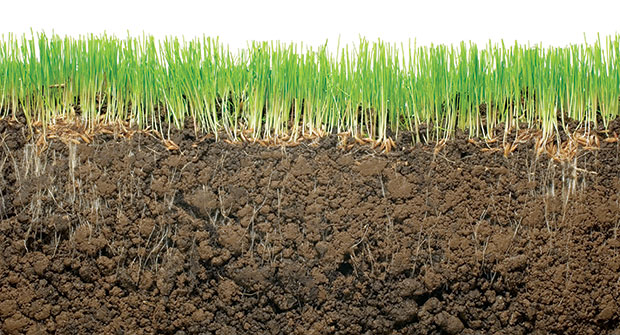
This component is determined by the amount of soil moisture depletion, so you’ll need to determine the root zone depth, plant available water per inch depth and the fraction of water that can be extracted without plant stress (p). The p variable ranges slightly from 0.4 (annuals and cool-season turfgrass) to 0.6 (trees and shrubs).
Here’s how to determine Ks:
TAW (total available water) – depletion root zone
(1-p) x TAW
5. Factor for Evaporation (Ke)
This number can jump to 1.35 following wetting events (both rain and irrigation). Roots typically grow during the spring, so don’t short them of water during that season. Adjust the watering amounts slowly so the roots don’t get stressed.
Also, don’t just increase irrigation runtimes and frequencies to fix problems. That approach can increase evaporation from wet surfaces and make more gallons necessary to avoid stress. Instead, you need to identify and implement the correct solution for the specific landscape. Remember: Whatever level you water to will become your new root zone.
6. Factor for Microclimate (Kmc)
It will increase during harsh conditions like direct sunlight near pavement, reflective windows and windy conditions. Shade, being shielded from wind and areas away from hot or dry surfaces will decrease this factor. This factor needs to be adjusted to match the site’s conditions.
photo: ©istock.com/redmal


